Effect of Cold Drawing and Heat Treating on Powder Metallurgy
White Papers
Effect of Cold Drawing and Heat Treating on Powder Metallurgy Processed ASTM F 1537 Alloy 1 & Alloy 2 Barstock
Abstract
ASTM Standard F 1537 provides the chemical, mechanical and metallurgical property requirements for barstock produced from three grades of cobalt, 28% chromium, 6% molybdenum alloys. The barstock is subsequently either forged and/or machined to produce medical implant components, such as femoral stems, femoral heads, acetabular cups, fixation screws and pins. Alloy 1 and Alloy 2 referenced in this standard are respectively low carbon (LC) and high carbon (HC) alloys. Barstock made from these alloys can be produced by either cast/wrought or powder metallurgy (P/M) processing. This paper discusses the manufacturing process used to produce P/M barstock of these two alloys and their resultant mechanical, physical, and metallurgical properties. The effects of cold drawing and annealing on the properties of Alloy 1 and the effect of thermal aging treatments on the properties of Alloy 2 are also presented.
Introduction
Historically, cast high carbon ASTM F 75 Co-28Cr-6Mo alloy was used for the production of medical implants. Over time implant manufacturers wanted to be able to obtain wrought barstock for certain applications requiring higher mechanical properties than that attainable with castings. The high carbon F75 composition did not possess good hot workability, and a low carbon, high nitrogen variation was developed and is commercially available from Carpenter Technology Corporation and other specialty metals suppliers. This low carbon, high nitrogen composition is typically produced by vacuum induction melting followed by electroslag remelting and has been used to produce implant devices for about 30 years. Implant manufacturers still desired a wrought high carbon Co-28Cr-6Mo alloy for certain applications. Manufacturers of the wrought low carbon, high nitrogen alloy have over the past few years improved the technology to produce the desired high carbon version of this alloy. Some manufacturers use cast/wrought processing to produce this alloy. Carpenter Technology Corporation utilizes its Micro-Melt® powder metallurgy (P/M) process to produce its version of this high carbon alloy and also produces the low carbon alloy with this same technology.
Since it is common in the implant industry to refer to these alloys collectively as “cobalt-chromium-molybdenum” alloys, an ASTM standard (ASTM F 1537) was established to distinguish the chemistry differences between these two alloys (which is essentially the carbon level of the alloys) and a third similar alloy. This standard now permits users of these alloys to properly identify them as well as specify what mechanical properties are required for the barstock. ASTM F 1537 identifies the low carbon alloy as Alloy 1, which contains 0-0.14% C, and the high carbon alloy as Alloy 2, which contains 0.15-0.35% C. This standard is also used to define the barstock requirements for the manufacture of ASTM F 799 forgings.
As stated earlier, Carpenter uses its Micro-Melt P/M process to produce ASTM F 1537 Alloy 1 (Micro-Melt BioDur® CCM Alloy) and Alloy 2 (BioDur CCM Plus® Alloy) barstock to take advantage of the inherent uniformity and refined microstructure that is obtained using prealloyed, gas atomized high purity metal powders. P/M processing is particularly applicable to the Alloy 2 compostion, where a distribution of uniform, fine carbides is produced.
Studies were performed by Carpenter to determine the effect of cold drawing and thermal aging on the mechanical and metallurgical characteristics of its P/M ASTM F 1537 alloy barstock. Both cold working and thermal aging historically would be expected to increase the strength of these alloys. The goal of this work was to obtain information that would be helpful to establishing alternative processing operations and new applications for these alloys.
Micro-Melt P/M Barstock Manufacturing Process
The Micro-Melt Process (Figure 1) begins with the manufacture of high purity, gas atomized, prealloyed powder using a 2000 lb. vacuum induction melting gas atomization unit. The atomized powder is screened to produce powder of a predetermined mesh size and the powders from several heats are then blended together to produce nominal 10,000 lb. powder blends. Each powder blend is used to fill several metal canisters, which are then evacuated, outgassed and sealed. The sealed canisters are then hot isostatically pressed (HIP’d) to full denseness. The HIP’d canisters are then hot worked to produce hot rolled bars. The hot rolled bars are then processed to finish size and tested per customer requirements.
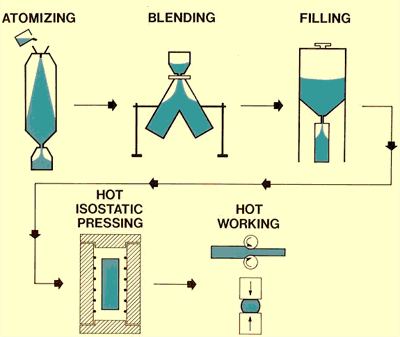
1: Pictorial Description of the Micro-Melt®
Powder Manufacturing Process
Properties of P/M Alloy 1 (LC) and Alloy 2 (HC) Barstock
Both of these P/M alloys are normally processed to meet the ASTM F 1537 “warm worked” room temperature requirements (120 ksi minimum 0.2% yield strength, 170 ksi minimum ultimate tensile strength, 12% minimum elongation in 4D and 12% reduction of area). In this condition these alloys have an elastic modulus of 35 million psi, a shear modulus of 13.4 million psi, a Poisson’s ratio of 0.30 in the elastic range, and a hardness of 42-44 HRC. Both alloys have excellent chemical and microstrutural uniformity , a fine grain size (typically ASTM E 112 grain size #12), and possess good hot workability and consistent machinability. Alloy 2 differs from Alloy 1 in that its microstructure contains a uniform distribution of small carbides as shown in Table 1 below:
Table 1: Carbide Morphology for Alloys 1 and 2
|
Alloy |
Volume % |
Avg. Length |
Avg. Area |
|
1 |
0.03% |
1.3 μm |
1.4 μm2 |
|
2 |
5% |
2.4 μm |
3.4 μm2 |
As noted previously, P/M processing permits Alloy 2’s carbide distribution to be significantly more uniform than when Alloy 2 is made by cast/wrought processing. Figures 2A and 2B show the longitudinal microstructures for barstock produced from each of these Alloy 2 processing routes.
As shown in Figure 2B, P/M alloy 2 does not display the carbide banding shown in Figure 2A.

Figure 2A: Cast/Wrought Alloy 2; Hot rolled barstock; longitudinal Section; 400X; Etchant: HCL + H2O2 (3%)

Figure 2B: P/M Alloy 2; Hot rolled barstock; longitudinal Section; 400X; Etchant: HCL + H2O2 (3%)
The mechanical properties of Alloy 1 and Alloy 2 are similar. Alloy 2, with its higher carbon content, has the ability to warm work more readily than Alloy 1 and retains higher strength levels after annealing. Tables 2A and 2B show typical mechanical properties for these two alloys.
Table 2A: Typical RT Mechanical Properties of P/M Alloy 1
|
Alloy 1 Condition |
0.2%YS/UTS/Elong/RA (KSI/KSI/%/%) |
Hardness (HRC) |
|
Warm Worked |
135 / 190 / 26 / 23 |
43-45 |
|
Hot Worked |
110 / 160 / 25 / 23 |
33 |
|
Annealed 2050F/1Hr/WQ |
85 / 150 / 25 / 23 |
30 |
Table 2B: Typical RT MechanicalProperties of P/M Alloy 2
|
Alloy 2 Condition |
0.2%YS/UTS/Elong/RA (KSI/KSI/%/%) |
Hardness (HRC) |
|
Hot Worked |
135 / 198 / 22 / 12 |
43-45 |
|
Annealed 2000F/1Hr/WQ |
128 / 196/ 22/ 18 |
42 |
|
Anealed 2050F/1Hr/WQ |
123 / 203 / 28 / 24 |
41 |
|
Annealed 2100F/1Hr/WQ |
117 / 202 / 29 / 25 |
40 |
|
Annealed 2200F/2HRS/WQ |
104 / 190 / 32 / 27 |
35 |
|
ASTM F 1537 Warm Worked Minimums |
120 / 170 / 12 / 12 |
------ |
Room temperature R.R. Moore rotating beam fatigue testing of warm-worked Alloy 1 and hot-worked Alloy 2 has also been performed. This testing showed that the endurance limit (stress required to attain a minimum life of 10 million cycles) and the mode of failure for these alloys varied as a function of the test frequency as shown in Table 3 below:
Table 3: R.R. Moore Fatigue Strengths for Alloys 1 & 2
|
Alloy |
Test Frequency |
Endurance Limit |
Failure Due To |
|
Alloy 1 |
6000 &10,000 rpm |
115 ksi |
Fracture |
|
Alloy 2 |
10,000 rpm |
118.5 ksi |
Heating |
|
Alloy 2 |
6,000 rpm |
135 ksi |
Fracture |
|
Alloy 2 |
1,000 rpm |
142.5 ksi |
Fracture |
he heating failure of Alloy 2 had been observed to occur in other FCC materials. The cause for this behavior is not understood but is believed to be a combination of restricted dislocation movement due to the presence of a fine grain size and a finely dispersed carbide phase.
Effect of Cold Drawing and Annealing on the Properties of P/M Alloy 1 (LC Alloy)
A study was performed to document the effect of cold working and annealing on the properties of 0.05% carbon P/M Alloy 1, hot rolled small diameter coil-to-bar product that met the warm-worked requirements of ASTM F 1537. This work was performed to determine if cold drawing and annealing could be used to produce smaller diameter bars, instead of turning and grinding the bars to make smaller diameter bars. For this study hot rolled, unannealed 0.335” rd. finished barstock was used as the starting material. The properties of this barstock are shown in the first row of data shown in Tables 4 and 5. The cold drawing operations were performed using a draw bench with a draw speed of nominally 17 ft./min. Initial drawing trials were performed with unannealed barstock and it was quickly learned that the barstock could not be successfully drawn. In subsequent drawing trials, the starting barstock was annealed and then drawn. The annealing cycle used was heating the material in an argon atmosphere (to protect the surface from oxidation) for 100 minutes at 2050°F followed by water quenching to room temperature. After annealing, several bars were then given a drawing reduction of 10, 20, 25, and 30% and were evaluated. Some of these bars were also given a second anneal and were then redrawn, using the same drawing reduction used before the second annealing. These bars were also evaluated. The bar evaluation consisted of performing RT tension tests, determining bar center and bar surface hardnesses, using x-ray diffraction to obtain the amount of HCP phase present in the barstock, performing R.R. Moore rotating beam fatigue tests, and evaluating the microstructure of finished bars and the fracture surfaces of selected broken fatigue test specimens. The mechanical properties, surface and center hardnesses, and weight % HCP phase that were attained from this study are shown in Tables 4 and 5 and graphically depicted in Figures 3a through 3d.
Table 4: Core & Center Hardness, and Weight % HCP Phase from P/M Alloy 1 Cold Working Study
|
Condition/span> |
Wt% HCP |
Hardness (HRC) |
|
|
Core |
Surface |
||
|
Unannealed 0.335” rd. |
11% |
50 |
51.6 |
|
Annealed (A) |
8% |
38.4 |
39.7 |
|
A + 10% R |
21% |
49.3 |
43.2 |
|
A + 20% R |
32% |
53 |
45.2 |
|
A + 25% R |
30% |
54.5 |
45.8 |
|
A + 30% R. |
38% |
55.7 |
45.6 |
|
A+10%R+A+10%R |
18% |
48.1 |
40.6 |
|
A+20%R+A+20%R |
21% |
52.1 |
43.5 |
|
A+25%R+A+25%R |
27% |
53.4 |
42.8 |
|
A = Annealed @ 2050°F/100 min + WQ RR = Reduction of Area (Drawing Reduction) |
|||
Table 5: Mechanical Properties of P/M Alloy 1 from Cold Working Study
|
Condition/span> |
0.2% YS (ksi) |
UTS (ksi) |
% Elong in 4D |
% Red of Area |
|
Unannealed 0.335” rd. |
145.4 |
212.0 |
30.8 |
34.0 |
|
Annealed (A) |
107.6 |
188.7 |
38.0 |
34.2 |
|
A + 10% R |
101.3 |
213.8 |
27.1 |
32.0 |
|
A + 20% R |
129.8 |
238.9 |
16.3 |
23.1 |
|
A + 25% R |
178.4 |
261.2 |
9.6 |
18.3 |
|
A + 30% R. |
202.2 |
289.1 |
6.6 |
17.9 |
|
A+10%R+A+10%R |
114.0 |
213.1 |
31.9 |
38.2 |
|
A+20%R+A+20%R |
175.7 |
239.8 |
16.8 |
24.3 |
|
A+25%R+A+25%R |
194.5 |
277.2 |
9.5 |
17.0 |
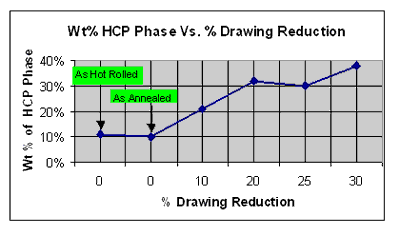
Figure 3a: Weight % HCP Phase vs. % Drawing Reduction
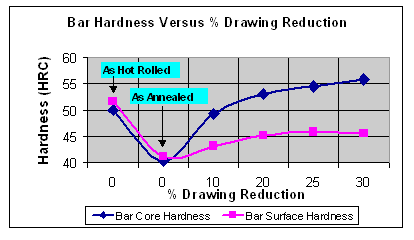
Figure 3b: Bar Hardness vs. % Drawing Reduction
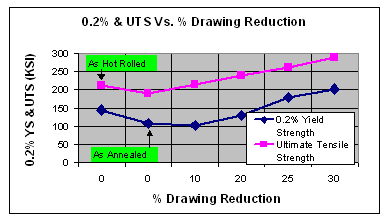
Figure 3c: 0.2% YS & UTS vs. % Drawing Reduction
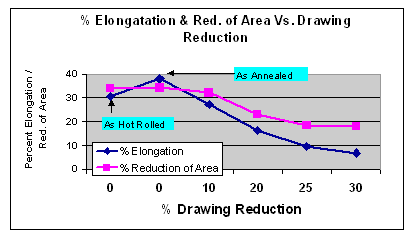
Figure 3d: % Elongation & Reduction of Area vs. % Drawing Reduction
R.R. Moore rotating beam fatigue tests were also performed for all of the conditions that are shown in Table 4. All of the material, except for the starting 0.335” round barstock and one of two test specimens for the annealed material failed to meet the desired endurance limit of 115 ksi using a test frequency of 6,000 rpm. SEM evaluation of the fracture surfaces revealed that areas of localized brittle fracture were present, whereas the starting material displayed only ductile fracture. The areas of locallized brittle fracture are believed to be related to the presence of locallized areas of heavy concentration of HCP phase that formed from the processing. Figure 4 shows a typical mixed-mode fracture surface for material that received a 25% drawing reduction.
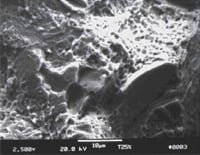
Figure 4: R.R. Moore Rotating Beam Fracture
Surface Showing Mixed Ductile-Brittle Fracture; 2,500x
Microstructural evaluation of the material conditions shown in Table 4 also revealed that the grain size of the material was significantly affected by the annealing and cold working cycles. Typical grain sizes obtained for materials that were drawn 20-25% are shown in Table 5.
Table 5: Grain Sizes for P/M Alloy 1 Barstock Processed with a Drawing Reduction of 20-25%
|
Condition/span> |
Grain Size (microns) |
|
Starting Unannealed 0.335” Rd. Bar |
7.9 |
|
Annealed (per Table 4) |
44.9 |
|
Cold Drawn 20-25% |
44.9 |
|
Annealed (per Table 4) |
127 |
|
Cold Drawn 20-25% |
89.8 |
The grain size data show that the fine grain size of the starting unannealed material was not obtained with the subsequent processing. The resultant coarse grain size is believed to be the main factor causing the reduction in fatigue properties. The presence of HCP phase in the starting unannealed barstock and the inability to achieve the desired fatigue life in the as annealed condition (which has the same amount of HCP phase as the starting unannealed barstock) supports this hypothesis.
The results of the cold working study show P/M Alloy 1:
· Requires annealing prior to cold working to reduce the strength and increase ductility of the starting barstock
· Yield strength and UTS can be significantly increased by cold working.
· Can be cold-drawn up to 30% in a single reduction operation, but reductions no larger than 20% should be used to meet ASTM F 1537’s warm-worked requirements
· Undergoes significant FCC to HCP phase transformation when cold worked
· Has an unexpected decrease in hardness from the core to the surface of the bar
· Must be used without annealing or cold working, if an R.R. Moore rotating beam endurance limit of at least 115 ksi (@ test frequency of 6,000 rpm) is desired
Effect of Thermal Aging on P/M Alloy 2 (HC Alloy)
A study was performed to document the effect of thermal aging treatments on the hardness and microstructure of 0.24%C P/M Alloy 2, hot rolled nominal 1.3” rd. barstock that met the warm-worked requirements of ASTM F 1537. This work was performed to determine the maximum hardness that could be attained and to define the heat treating cycle to obtain this hardness. Increased bar hardness could be beneficial in certain applications.
In this study nominal 3/4” long test specimens were cut from the starting barstock and were given a thermal aging treatment that consisted of heating the samples in an air furnace at specified temperatures and for specified times, followed by air cooling to room temperature. The specimens were then sandblasted to remove surface scale and cut in half. The cut surfaces were then prepared and hardness tested. One sample from each condition was prepared for light optical microscopy and was etched using HCL with a few drops of 3% concentration hydrogen peroxide (H2O2). Based on the optical microscopy results, additional samples of selected aging conditions were prepared and submitted for SEM photography.
The hardness results of the aging study (Table 6 and Figures 5 and 6) show that a maximum hardness of 53.8 HRC was obtained with a 1350°F/24 hr. aging cycle.
Table 6: P/M Alloy 2 Thermal Aging Hardness Results (HRC)
|
Time (hrs.)/span> |
Temperature (°F) |
||||
|
1050°F |
1150°F |
1250°F |
1350°F |
1450°F |
|
|
HRC |
HRC |
HRC |
HRC |
HRC |
|
|
1 |
45.8 |
46.0 |
46.3 |
46.5 |
48.0 |
|
4 |
45.5 |
46.0 |
46.5 |
50.8 |
48.6 |
|
8 |
45.8 |
45.7 |
47.4 |
52.0 |
51.0 |
|
16 |
45.8 |
46.1 |
50.0 |
52.7 |
51.0 |
|
24 |
--- |
--- |
51.0 |
53.8 |
--- |
|
48 |
--- |
--- |
53.7 |
53.8 |
--- |
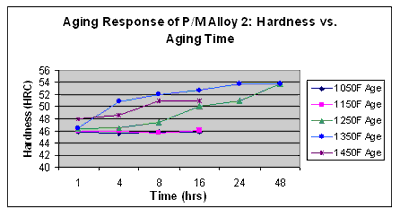
Figure 5: Aging Response of P/M Alloy2: Hardness vs. Aging Time
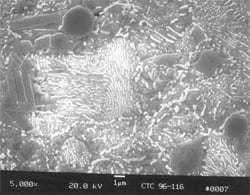
Typical SEM photomicrographs for 1 hr. & 16 hr. times at 1350°F are shown in Figures 7 and 8. The FCC to HCP transformation (light phase) was seen to initiate essentially at the grain boundaries and then grows within the grains over time as shown in these photomicrographs.
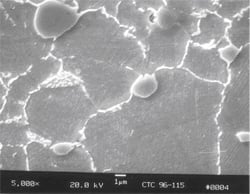
Figure 7: SEM Photomicrograph of 1350°F/1hr
Aged P/M Alloy 2; 5,000x
Figure 8: SEM Photomicrograph of 1350°F/16hr Aged P/M Alloy 2; 5,000x
The results of this thermal aging study show:
· The hardness of the starting barstock can be increased from typically 43-45 HRC to nominally 54 HRC with a 24 hr thermal age at 1350°F.
· 1350°F is the peak aging temperature for this alloy.
Acknowledgements:
Muriel Gillot & Aaron Teske worked at Carpenter Technology as intern/co-op students. Their efforts in the processing and documentation of these cold-working and thermal aging studies were invaluable to the preparation of this paper.
Gregory Del Corso
Carpenter Powder Products, Reading, PA, USA
